## 1.设置当前工作目录
setwd("./RCircos")
## 2.安装和导入R包:RCircos
# install.packages("RCircos")
library("RCircos")
## 3.RCircos包简要信息
### 3.1 DESCRIPTION
# Package: RCircos
# Type: Package
# Title: Circos 2D Track Plot
# Version: 1.2.1
# Date: 2019-03-10
# Author: Hongen Zhang
# Maintainer: Hongen Zhang
# Description: A simple and flexible way to generate Circos 2D track plot images for genomic data visualization is implemented in this package. The types of plots include: heatmap, histogram, lines, scatterplot, tiles and plot items for further decorations include connector, link (lines and ribbons), and text (gene) label. All functions require only R graphics package that comes with R base installation.
# License: GPL (>= 2)
# Depends: R (>= 2.10)
# URL: http://bitbucket.org/henryhzhang/rcircos
# NeedsCompilation: no
# Packaged: 2019-03-12 16:32:41 UTC; hzhang
# Repository: CRAN
# Date/Publication: 2019-03-12 21:06:27 UTC
# Built: R 3.6.0; ; 2019-05-28 21:23:44 UTC; windows
### 3.2 MAIN FUNCTION
ls(package:RCircos)
# [1] "RCircos.Adjust.Scatter.Values"
# [2] "RCircos.Area.Highlight"
# [3] "RCircos.Area.Plot"
# [4] "RCircos.Chromosome.Ideogram.Plot"
# [5] "RCircos.Clear.Track"
# [6] "RCircos.Clear.Zoom.Area"
# [7] "RCircos.Customized.Connection.Plot"
# [8] "RCircos.Customized.Shape.Plot"
# [9] "RCircos.Data.Point"
# [10] "RCircos.defaultBasePerUnits"
# [11] "RCircos.defaultCharWidth"
# [12] "RCircos.defaultChromPadding"
# [13] "RCircos.defaultCircosUnits"
# [14] "RCircos.defaultTextSize"
# [15] "RCircos.Draw.Chromosome.Ideogram"
# [16] "RCircos.Env"
# [17] "RCircos.Gene.Connector.Plot"
# [18] "RCircos.Gene.Name.Plot"
# [19] "RCircos.Get.Arrow.Shape"
# [20] "RCircos.Get.Chromosome.Order"
# [21] "RCircos.Get.Data.Point.Height"
# [22] "RCircos.Get.Default.Base.Per.Units"
# [23] "RCircos.Get.Default.Char.Width"
# [24] "RCircos.Get.Default.Chrom.Padding"
# [25] "RCircos.Get.Default.Circos.Units"
# [26] "RCircos.Get.Default.Text.Size"
# [27] "RCircos.Get.Gene.Label.Locations"
# [28] "RCircos.Get.Gene.Name.Plot.Parameters"
# [29] "RCircos.Get.Heatmap.Color.Scale"
# [30] "RCircos.Get.Heatmap.Color.Scale.Location"
# [31] "RCircos.Get.Heatmap.Data.Colors"
# [32] "RCircos.Get.Link.Colors"
# [33] "RCircos.Get.Padding.Constant"
# [34] "RCircos.Get.Paired.Points.Positions"
# [35] "RCircos.Get.Plot.Boundary"
# [36] "RCircos.Get.Plot.Colors"
# [37] "RCircos.Get.Plot.Ideogram"
# [38] "RCircos.Get.Plot.Layers"
# [39] "RCircos.Get.Plot.Parameters"
# [40] "RCircos.Get.Plot.Positions"
# [41] "RCircos.Get.Polygon.Height"
# [42] "RCircos.Get.Single.Point.Positions"
# [43] "RCircos.Get.Start.End.Locations"
# [44] "RCircos.Get.Supported.HeatmapColors"
# [45] "RCircos.Get.Supported.Plot.Types"
# [46] "RCircos.Get.Track.Positions"
# [47] "RCircos.Get.Zoom.Data"
# [48] "RCircos.Get.Zoom.Range"
# [49] "RCircos.Heatmap.Plot"
# [50] "RCircos.heatmapColors"
# [51] "RCircos.Highligh.Chromosome.Ideogram"
# [52] "RCircos.Histogram.Plot"
# [53] "RCircos.Ideogram.Tick.Plot"
# [54] "RCircos.Initialize.Plot.Parameters"
# [55] "RCircos.Label.Chromosome.Names"
# [56] "RCircos.Label.Zoom.Region"
# [57] "RCircos.Line.Plot"
# [58] "RCircos.Link.Line"
# [59] "RCircos.Link.Plot"
# [60] "RCircos.List.Plot.Parameters"
# [61] "RCircos.Mark.Zoom.Area"
# [62] "RCircos.Multiple.Species.Core.Components"
# [63] "RCircos.Multiple.Species.Dataset"
# [64] "RCircos.paddingConst"
# [65] "RCircos.Parallel.Line.Plot"
# [66] "RCircos.Plot.Heatmap.Color.Scale"
# [67] "RCircos.Plot.Zoomed.Area"
# [68] "RCircos.Plot.Zoomed.Continue.Lines"
# [69] "RCircos.Plot.Zoomed.Gene.Connectors"
# [70] "RCircos.Plot.Zoomed.Heatmap"
# [71] "RCircos.Plot.Zoomed.Histogram"
# [72] "RCircos.Plot.Zoomed.Ideogram.Ticks"
# [73] "RCircos.Plot.Zoomed.Parallel.Lines"
# [74] "RCircos.Plot.Zoomed.Polygons"
# [75] "RCircos.Plot.Zoomed.Scatters"
# [76] "RCircos.Plot.Zoomed.Tiles"
# [77] "RCircos.Plot.Zoomed.Vertical.Lines"
# [78] "RCircos.plotTypes"
# [79] "RCircos.Point.Plot"
# [80] "RCircos.Polygon.Plot"
# [81] "RCircos.Pseudo.Ideogram.From.Labels"
# [82] "RCircos.Pseudo.Ideogram.From.Table"
# [83] "RCircos.Reset.Plot.Ideogram"
# [84] "RCircos.Reset.Plot.Parameters"
# [85] "RCircos.Reset.Plot.Positions"
# [86] "RCircos.Ribbon.Plot"
# [87] "RCircos.Scatter.Plot"
# [88] "RCircos.Set.Base.Plot.Positions"
# [89] "RCircos.Set.Core.Components"
# [90] "RCircos.Set.Cytoband.Data"
# [91] "RCircos.Set.Plot.Area"
# [92] "RCircos.Set.Zoom.Plot.Positions"
# [93] "RCircos.Sort.Genomic.Data"
# [94] "RCircos.Tile.Plot"
# [95] "RCircos.Track.Outline"
# [96] "RCircos.Validate.Cyto.Info"
# [97] "RCircos.Validate.Genomic.Data"
# [98] "RCircos.Validate.Genomic.Info"
# [99] "RCircos.Validate.Plot.Parameters"
# [100] "RCircos.Validate.Track.Positions"
# [101] "RCircos.Vertical.Line.Plot"
# [102] "RCircos.Workflow"
# [103] "RCircos.Zoom.Area.Outline"
# [104] "RCircos.Zoom.Paired.Plot.Positions"
# [105] "RCircos.Zoom.Single.Plot.Positions"
# [106] "RCircos.ZoomIn.Chromosome"
# [107] "RCircos.ZoomOut.Chromosome"
## 4.导入测试数据以及绘制复合染色体模式图(Circos)
#@ 导入测试数据
data(RCircos.Histogram.Data)
head(RCircos.Histogram.Data)
# Chromosome chromStart chromEnd Data
# 1 chr1 45000000 49999999 0.070859
# 2 chr1 55000000 59999999 0.300460
# 3 chr1 60000000 64999999 0.125421
# 4 chr1 70000000 74999999 0.158156
# 5 chr1 75000000 79999999 0.163540
# 6 chr1 80000000 84999999 0.342921
data(RCircos.Heatmap.Data)
head(RCircos.Heatmap.Data)
# Chromosome chromStart chromEnd GeneName X786.O A498
# 1 chr1 934341 935552 HES4 6.75781 7.38773
# 2 chr1 948846 949919 ISG15 7.56297 10.49590
# 3 chr1 1138887 1142089 TNFRSF18 4.69775 4.55593
# 4 chr1 1270657 1284492 DVL1 7.76886 7.52194
# 5 chr1 1288070 1293915 MXRA8 4.49805 4.72032
# 6 chr1 1592938 1624243 SLC35E2B 8.73104 8.10229
# A549.ATCC ACHN BT.549 CAKI.1
# 1 6.47890 6.05517 8.85062 7.00307
# 2 5.89893 7.58095 12.08470 7.81459
# 3 4.38970 4.50064 4.47525 4.47721
# 4 6.87125 7.03517 7.65386 7.69733
# 5 4.62207 4.58575 5.66389 4.93499
# 6 8.36599 9.04116 9.24175 9.89727
data(RCircos.Link.Data)
head(RCircos.Link.Data)
# Chromosome chromStart chromEnd Chromosome.1 chromStart.1
# 1 chr1 8284703 8285399 chr1 8285752
# 2 chr1 85980143 85980624 chr7 123161313
# 3 chr1 118069850 118070319 chr1 118070329
# 4 chr1 167077258 167077658 chr1 169764630
# 5 chr1 171671272 171671550 chr1 179790879
# 6 chr1 174333479 174333875 chr6 101861516
# chromEnd.1
# 1 8286389
# 2 123161687
# 3 118070689
# 4 169764965
# 5 179791292
# 6 101861840
data(UCSC.HG19.Human.CytoBandIdeogram);
head(UCSC.HG19.Human.CytoBandIdeogram);
# Chromosome ChromStart ChromEnd Band Stain
# 1 chr1 0 2300000 p36.33 gneg
# 2 chr1 2300000 5400000 p36.32 gpos25
# 3 chr1 5400000 7200000 p36.31 gneg
# 4 chr1 7200000 9200000 p36.23 gpos25
# 5 chr1 9200000 12700000 p36.22 gneg
# 6 chr1 12700000 16200000 p36.21 gpos50
data(UCSC.Mouse.GRCm38.CytoBandIdeogram);
head(UCSC.Mouse.GRCm38.CytoBandIdeogram);
# Chromosome ChromStart ChromEnd Band Stain
# 1 chr1 0 8840440 qA1 gpos100
# 2 chr1 8840440 12278390 qA2 gneg
# 3 chr1 12278390 20136559 qA3 gpos33
# 4 chr1 20136559 22101102 qA4 gneg
# 5 chr1 22101102 30941543 qA5 gpos100
# 6 chr1 30941543 43219933 qB gneg
data(UCSC.Baylor.3.4.Rat.cytoBandIdeogram);
head(UCSC.Baylor.3.4.Rat.cytoBandIdeogram);
# Chromosome ChromStart ChromEnd Band Stain
# 1 chr1 0 10142096 p13 gneg
# 2 chr1 10142096 24272657 p12 gvar
# 3 chr1 24272657 38517175 p11 gneg
# 4 chr1 38517175 48659271 q11 gpos
# 5 chr1 48659271 69741157 q12 gneg
# 6 chr1 69741157 90025350 q21 gpos
chr.exclude <- NULL;
cyto.info <- UCSC.HG19.Human.CytoBandIdeogram;
tracks.inside <- 10;
tracks.outside <- 0;
RCircos.Set.Core.Components(cyto.info, chr.exclude, tracks.inside, tracks.outside);
?RCircos.Reset.Plot.Parameters
rcircos.params <- RCircos.Get.Plot.Parameters();
rcircos.cyto <- RCircos.Get.Plot.Ideogram();
rcircos.position <- RCircos.Get.Plot.Positions();
RCircos.List.Plot.Parameters()
rcircos.params <- RCircos.Get.Plot.Parameters();
rcircos.params$base.per.unit <- 3000;
RCircos.Reset.Plot.Parameters(rcircos.params);
RCircos.List.Plot.Parameters();
### 4.1 Initialize Graphic Device
#@ RCircos provides a set of graphic plot functions but does not handle graphic devices. To make RCircos plots, a graphic device has to be opened first. Currently, RCircos works with files supported by R graphics package such as tiff, png, pdf images as well as GUI windows. For example, to make a pdf file with RCircos plot image:
out.file <- "RCircosDemoHumanGenome.pdf";
pdf(file=out.file, height=8, width=8, compress=TRUE);
RCircos.Set.Plot.Area();
#@ RCircos.Set.Plot.Area() will setup plot area base on total number of tracks inside and outside of chromosome ideogram. User can also setup plot area by summit the R plot commands for user defined plot area, for example:
par(mai=c(0.25, 0.25, 0.25, 0.25));
plot.new();
frame()
plot.window(c(-2.5,2.5), c(-2.5, 2.5));
#@ After everything is done, the graphic device needs to be closed with dev.off()
### 4.2 Plot Chromosome Ideogram
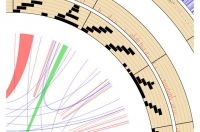
#@ For RCircos plot, a common first step is to draw chromosome ideograms and label chromosomes with names and highlights. After the RCircos core components were initialized and graphic device was open, simply call the function of RCircos.Chromosome.Ideogram.Plot() will add the chromosome ideogram to the current plot.
RCircos.Chromosome.Ideogram.Plot();
### 4.3 Gene Labels and connectors on RCircos Plot
#@ Due to the resolution issues, only limited number of gene names can be labeled. For best visualization, cex should be no less than 0.4 when draw gene labels.
data(RCircos.Gene.Label.Data);
name.col <- 4;
side <- "in";
track.num <- 1;
RCircos.Gene.Connector.Plot(RCircos.Gene.Label.Data, track.num, side);
track.num <- 2;
RCircos.Gene.Name.Plot(RCircos.Gene.Label.Data, name.col,track.num, side);
### 4.4 Heatmap, Histogram, Line, Scatter, and Tile Plot
#@ Heatmap, histogram, line, scatter, and tile plot with RCircos require that the first three columns of input data are genomic position information in the order of chromosome name, start, and end position.
data(RCircos.Heatmap.Data);
data.col <- 6;
track.num <- 5;
side <- "in";
RCircos.Heatmap.Plot(RCircos.Heatmap.Data, data.col, track.num, side);
data(RCircos.Scatter.Data);
data.col <- 5;
track.num <- 6;
side <- "in";
by.fold <- 1;
RCircos.Scatter.Plot(RCircos.Scatter.Data, data.col, track.num, side, by.fold);
data(RCircos.Line.Data);
data.col <- 5;
track.num <- 7;
side <- "in";
RCircos.Line.Plot(RCircos.Line.Data, data.col, track.num, side);
data(RCircos.Histogram.Data);
data.col <- 4;
track.num <- 8;
side <- "in";
RCircos.Histogram.Plot(RCircos.Histogram.Data, data.col, track.num, side);
data(RCircos.Tile.Data);
track.num <- 9;
side <- "in";
RCircos.Tile.Plot(RCircos.Tile.Data, track.num, side);
### 4.5 Links: A Special Plot
#@ Links presents relationship of two genomic positions and it is always the last track inside chromosome ideogram. Different from other data plots, input data for links plot is a data frame with paired genomic positions in the order of chromosome, start, and end position for each one genomic position.
data(RCircos.Link.Data);
track.num <- 11;
RCircos.Link.Plot(RCircos.Link.Data, track.num, TRUE);
data(RCircos.Ribbon.Data);
RCircos.Ribbon.Plot(ribbon.data=RCircos.Ribbon.Data, track.num=11, by.chromosome=FALSE, twist=FALSE);
dev.off();
### 4.6 More Information
demo("RCircos.Demo.Human");
demo("RCircos.Demo.Mouse.And.Rat");
## 5.结束
sessionInfo()
# R version 3.6.3 (2020-02-29)
# Platform: x86_64-w64-mingw32/x64 (64-bit)
# Running under: Windows 10 x64 (build 18363)
#
# Matrix products: default
#
# locale:
# [1] LC_COLLATE=Chinese (Simplified)_China.936
# [2] LC_CTYPE=Chinese (Simplified)_China.936
# [3] LC_MONETARY=Chinese (Simplified)_China.936
# [4] LC_NUMERIC=C
# [5] LC_TIME=Chinese (Simplified)_China.936
#
# attached base packages:
# [1] stats graphics grDevices utils datasets methods
# [7] base
#
# other attached packages:
# [1] RCircos_1.2.1
#
# loaded via a namespace (and not attached):
# [1] compiler_3.6.3 tools_3.6.3 packrat_0.5.0


